SaaS GTM strategies fail upstream of execution. The motion launches, the team performs, and the numbers still miss because the assumptions underneath the plan, the ICP, the messaging, the segment, the motion design, were never tested before they got institutionalized. By the time a pipeline review surfaces the gap, six quarters of decisions are pointing in the wrong direction.
If you are a CMO, CRO, or VP at a Series A through C SaaS company watching the gap between effort and outcome grow wider than market noise can explain, the failure is almost certainly not in the execution layer. It is in the architecture you signed off on before execution began. Win rates compress. CAC payback extends. NRR drifts below 110%. The team is doing what the plan asked of them.
GTM strategies don’t fail in execution. They fail in the assumptions execution inherits.
There are six structural failure modes that produce that gap. Confusing product-market fit with GTM fit. Building a launch instead of a system. Signing off on an ICP that was never validated. Letting internal consensus dictate messaging. Mistaking aligned decks for aligned teams. Ignoring post-sale as a GTM motion. Each one is an architectural choice made by a leader, not a tactical miss made by a team.
The scale of the problem is structural, not anecdotal. CB Insights and Startup Genome data shows roughly 92% of SaaS startups fail within three years. About 42% fail from no market need. About 13% fail from poorly executed GTM. The other 37% is the interesting number, and it lives largely in the territory this piece is about.
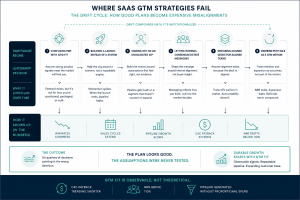
Most GTM Failure Is Drift, Not Collapse
Most GTM failure is not a crash. It is drift.
Drift happens when the motion, the message, the market, and the moment stop being aligned, but the team keeps running the plan as if they still are. Pipeline slows by a few percentage points per quarter. Win rates compress quietly. Sales cycles extend by two weeks, then four. Leaders attribute the slide to market conditions, channel saturation, or rep ramp. None of those explanations are wrong on their own. They are just rarely the root cause.
Drift is the dominant failure pattern because it does not trigger an alarm. It mimics normal variance until it has been institutionalized in headcount, comp plans, playbooks, and forecast models. By the time a board meeting names the problem, the operating model has already adapted around the failure.
Buyer behavior is one of the biggest accelerants of drift in the current cycle. G2 Learn research indicates more than 80% of B2B mid-market buyers complete most of their buying journey before they engage sales. Motions designed for a world where sales controlled the discovery phase are still running, and still being measured against benchmarks set when those motions worked. The benchmarks are the lagging indicator. The drift started years earlier.
What follows are the six mechanisms through which drift begins. Each one is a leadership decision, not an execution gap. Each one looks reasonable in the room where it gets made. Each one compounds.
PMF and GTM Fit Are Different States on Different Timelines
PMF and GTM fit are not the same state, and they are not on the same timeline.
PMF means the product delivers measurable value to a real customer. GTM fit means the motion, the messaging, the channel, and the segment are aligned to how those buyers actually buy. A company can have clear PMF and completely broken GTM fit at the same time.
The way the gap shows up in practice: strong NPS, high product engagement, low expansion. The buyers who love the product are not the buyers the GTM motion is targeting. Or a motion that worked at $1M ARR collapses at $5M because the segment that produced the early wins does not scale the way the financial model assumed. The product is fine. The way it gets taken to market is not.
Leaders miss the distinction because PMF gets celebrated and GTM fit gets assumed. Once the product has proven itself, the internal pressure to scale crowds out the structural question, which is whether the way you sell is aligned to the way buyers buy. Boards reward velocity. Velocity rewards execution. Execution does not pause to test the bet.
GTM fit is also not a fixed state. Fit can be achieved and then lost as buyers, competitors, and channels shift. Declining GTM metrics, not declining product metrics, are the signal. A leader who confuses the two will optimize the wrong variable for a year before catching it.
If your product engagement is strong and your revenue trajectory is not, GTM fit is the place to look first. Not pricing. Not messaging. Fit.
Launch Framing Produces Drift by Design
When leaders frame GTM as a campaign with a kickoff date and a launch quarter, they build teams, incentives, and review cycles optimized for the launch moment, not for sustained iteration.
The pattern is recognizable. Intense cross-functional energy in Q1. A launch event. A burst of pipeline activity. By Q2, the launch is “done.” Each function retreats to its own motion. The shared dashboard goes unreviewed. The messaging has not been tested against real buyer objections. The ICP has not been updated since the workshop that produced it. The iteration cadence dies and nobody owns the decision to restart it.
GTM-as-event is comfortable. It has deliverables, a timeline, and a clean definition of done. Quarterly business reviews reward that shape. GTM-as-system requires ongoing governance, shared accountability, and tolerance for the messy work of changing the plan mid-flight. None of those are naturally rewarded by the operating rhythm most SaaS companies run.
The cost is permanent post-launch drift. Teams stop iterating because no structured mechanism exists to iterate against. New buyer signals arrive and go unprocessed. Competitive moves happen and the positioning does not update. The plan that was right in January is wrong by July, and nothing in the operating model is set up to notice.
The shift is not from a bad launch to a better launch. The shift is from treating GTM as an event to treating it as a standing system with defined iteration cycles, owned by named people, with structured inputs from the field. What that looks like is the subject of the final section.
An Unvalidated ICP Is a Hypothesis, Not an ICP
Most ICPs in SaaS are not ICPs. They are workshop outputs that survived a leadership review.
The pattern looks like this. A team sits in a room for three hours. They synthesize founder intuition, a few customer interviews, and some industry research into a customer description that sounds plausible. A persona deck gets produced. Marketing builds campaigns against it. Sales builds territories against it. Six months later, win rates are flat in the named segment, and nobody can explain why.
The ICP was never validated. It was performed.
Real ICP validation is a research problem with falsifiable criteria. Before any leader signs off on an ICP, the question to demand is straightforward. What are the ten firmographic and behavioral attributes shared by the deals that closed fastest, expanded most, and churned least? That pattern is the ICP. The deck is a hypothesis until that pattern confirms it.
Leaders miss the step because validation requires pulling data across CRM, CS, and finance, and most organizations do not have a clean view of that intersection. Commissioning the analysis feels like slowing down. So the workshop output gets accepted as a working ICP, and the GTM motion gets built on top of a hypothesis no one tested.
The compounding cost is observable. Marketing generates volume for a segment sales cannot close at the expected rate. Sales chases deals that match the ICP deck but do not convert at the modeled velocity. CS inherits customers who were never a real fit and churns them, which shows up in NRR two quarters later, attributed to “onboarding friction” or “product gaps.”
A workshop is a useful place to generate ICP hypotheses. It is not a place to confirm them. The leaders who get this right treat the first version of an ICP as a bet, not as ground truth, and structure the next 60 days as the test.
Messaging That Survives Internal Review Rarely Survives Buyers
Positioning that survives internal review rarely survives buyer contact.
Feature-forward messaging is not a copywriting failure. It is the structural output of a process optimized for internal agreement over external signal. The homepage leads with capabilities. The sales deck reflects what the product team is proud of. The value proposition has been approved by every stakeholder and has never been repeated back, unprompted, by a single buyer.
The reason is mechanical, not cultural. The room that builds the messaging knows the product too well. Internal reviewers react to accuracy, asking whether the language describes what the product does. Buyers react to resonance, asking whether the language describes a problem they actually have. Those are different questions, and they produce different outputs. The first question, asked repeatedly, drives messaging toward feature lists. The second question, asked rarely, leaves the buyer’s actual language out of the asset entirely.
The cost is measurable. Research on integrated GTM approaches, including consistent buyer-validated messaging, shows companies reporting up to 125% increases in net revenue retention. The inverse is also visible in the data most leaders already have. Misaligned messaging shows up as longer sales cycles, lower win rates, and inflated CAC. It is not invisible. It is just attributed to other causes.
The fix is not a culture of customer feedback. Culture without mechanism is decoration. The fix is a structural pathway, a research-into-messaging pipeline, where external signal has formal authority to override internal preference. Loss interviews feed positioning reviews. Call recordings get coded for the language buyers actually use. Pipeline drop-off data shapes the next version of the deck. The signal moves into the messaging on a defined cadence, not because someone happened to listen to a Gong call.
If your messaging cannot point to the specific buyer interview, loss reason, or call recording that produced it, the messaging was built for the room, not the buyer.
Aligned Decks Are Not Aligned Teams
The most dangerous GTM dysfunction is the one that looks like alignment.
Teams share a slide. They attend the same QBR. They nod at the same strategy. And in practice, marketing’s MQL definition does not match sales’ working definition of a good lead. Sales closes deals that CS cannot successfully onboard because the use case got oversold to clear the quarter. The revenue leaders share a forecast slide that aggregates three different underlying models, and only the analyst who built it knows where the assumptions diverge.
Presentational alignment feels like operational alignment. When the deck says the same thing, it is easy to assume the teams mean the same thing. The divergence only surfaces at handoff points. By then, the damage is already in the pipeline.
Three handoff points produce measurable revenue leak. Marketing to sales, where lead-quality and definition gaps inflate cost per opportunity and depress conversion. Sales to CS, where expectation gaps at close produce churn that gets attributed to product. CS to growth, where expansion signals never reach the teams who could act on them. Each is a named leak, not a coordination inconvenience. Each is observable in the data. Each is owned by no one.
Real alignment is operational. It means shared definitions of an MQL, an SQL, an ICP-fit account, and a successful onboarding. It means shared data on those definitions, accessed by all three functions, in one source. It means success metrics that do not reward one function at the expense of another, which is the part most organizations skip.
Operational alignment is infrastructure. Presentational alignment is theater. A QBR deck is not a substitute for either.
Post-Sale Is a GTM Motion, Not a Retention Function
Expansion revenue, NRR, and CS-led growth are not retention metrics. They are GTM motions. Most functional leaders organize their thinking around a binary, acquire versus retain, and the binary is the failure.
The pattern is visible in the org chart. CS owns expansion conversations but has no GTM motion behind them. No segmented messaging framework for expansion triggers. No formal handoff from sales describing the buyer’s growth intent at the time of purchase. No comp structure that rewards expansion the way new logo gets rewarded. The “land and expand” strategy lives in the investor deck. It does not live in the CS team’s weekly operating rhythm.
The persistence is budgetary and structural. GTM budget, headcount, and strategic attention are front-loaded to acquisition. Post-sale is operationally managed, not strategically led. CS leaders are measured on churn prevention, which is a defensive metric, not on expansion capture, which is an offensive one.
Net Revenue Retention is the clearest signal of the failure. A company with NRR above 110% is growing from its existing base, which means every new logo acquired compounds the growth rate. A company with NRR below 100% is filling a leaking bucket, no matter how strong the top-of-funnel motion is. The math is brutal and well understood, and the org design at most SaaS companies still does not reflect it.
Post-sale GTM is a parallel motion. It has its own ICP, the question of which customers expand. It has its own messaging, the question of what triggers an expansion conversation. It has its own success metrics, NRR, expansion ARR, and referral-sourced pipeline.
Most teams are funding their weakest GTM motion, paid acquisition, and underfunding their strongest one, expansion. The capital efficiency case for inverting the mix is obvious in the unit economics. The reason it does not happen is that the operating model treats expansion as a CS responsibility rather than a revenue motion.
What GTM Fit Looks Like in Practice
GTM fit is not a vibe. It is a state with observable indicators.
If a leader wants to know whether the motion is working, three signals carry most of the weight:
- CAC payback period trending shorter, not longer, as the motion matures
- NRR above 110%, meaning the existing base is compounding growth without incremental acquisition spend
- Pipeline generated without proportional increases in spend, meaning the motion is creating pull, not just push
These are not aspirational benchmarks. They are diagnostic signals. If none of the three are trending in the right direction, the issue is structural, not executional. Adding headcount, replacing reps, or running a campaign refresh will not move them. The architecture underneath has to change.
The leaders who get this right do not wait for a board meeting to surface the gap. They run a quarterly read on the three indicators, treat any sustained negative trend as a signal to revisit one of the six failure modes, and build an iteration cycle into the operating model so the next bet gets tested before it gets scaled.
That is what a GTM system looks like. Not a launch. A standing test.
The Architectural Shift
Replacing the VP of Marketing will not fix an ICP that was never validated. Hiring more SDRs will not fix messaging built for internal consensus. A new dashboard will not fix teams that look aligned in the QBR and diverge at every handoff. The instinct to solve GTM underperformance with personnel changes or tooling investments is the same instinct that produced the failure in the first place, the assumption that GTM is an execution problem.
The leaders who close the gap between GTM performance and GTM potential stop treating misalignment as a management problem and start treating it as an architectural one. They write the strategy as a set of hypotheses. They treat the next 60 days as the test. They build the iteration cycle into the operating model, not into the offsite agenda. The shift is not about working harder on the same plan. It is about refusing to scale a bet that has not been validated.
If any of these failure modes feel familiar, the diagnostic starts with one question. Are you running a GTM system, or a GTM launch that never ended?
If the answer is uncomfortable, that is the right place to start the conversation. Subscribe to the OTN newsletter for the next piece in this series on how to run that diagnostic without rebuilding the org first.